Turning Numbers into Narratives: Custom Reporting and Dashboards for Subscription Businesses
- Travis Hall
- May 24, 2023
- 2 min read

In the era of Big Data, having access to data isn't enough. Businesses need to be able to understand and interpret that data effectively to make informed decisions. For subscription-based businesses, this task becomes even more critical due to the recurring nature of their revenue and the importance of customer retention. Enter custom reporting and dashboards - powerful tools that transform raw data into visually compelling insights.
Custom reporting involves tailoring data reports to meet the unique needs of your business. Instead of generic reports that provide a broad overview, custom reports focus on the metrics that matter most to your business, like churn rate, customer lifetime value (CLV), and average revenue per user (ARPU).
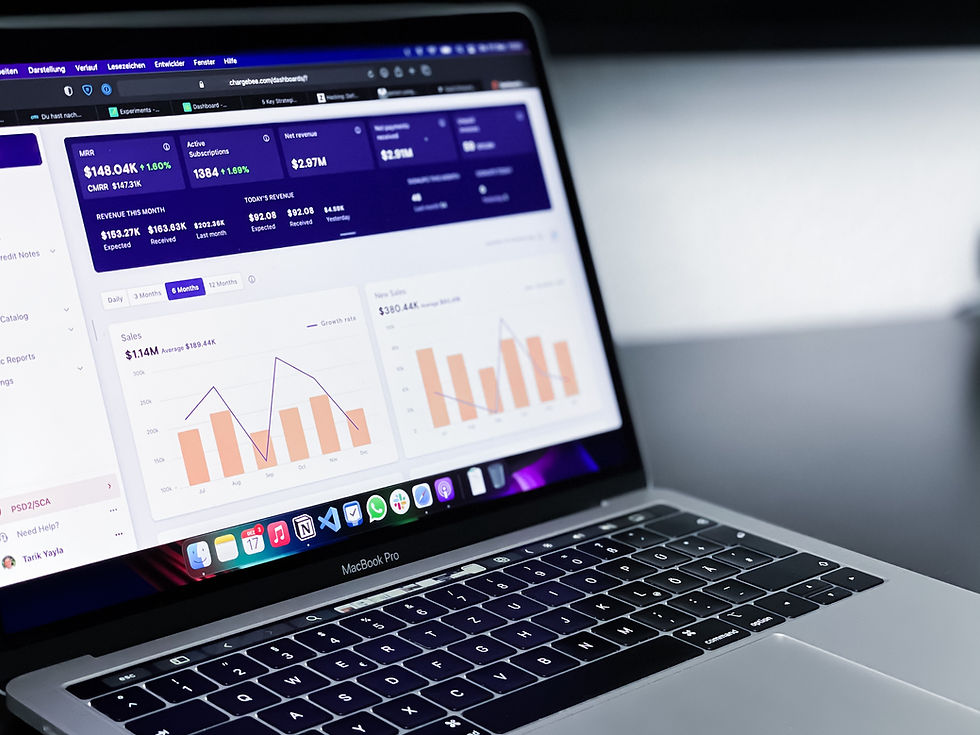
Dashboards, on the other hand, provide a visual representation of your data, making it easier to digest and interpret. With a well-designed dashboard, you can see at a glance how your business is performing and where you need to focus your efforts.
So how can custom reporting and dashboards empower your subscription business?
1. Focus on What Matters: With custom reports, you can focus on the metrics that are most relevant to your business. This allows you to track your performance against key business objectives effectively.
2. Real-Time Insights: Dashboards offer a real-time view of your data, enabling you to respond quickly to changes in customer behavior or market conditions.
3. Better Decision Making: By visualizing your data, dashboards can help you spot trends, identify opportunities, and make data-driven decisions.
4. Improved Communication: Dashboards can also improve communication within your team by providing a shared view of your business's performance. This can lead to more coordinated efforts and better results.
At Dataliction, we specialize in creating custom reports and dashboards that help subscription businesses make sense of their data. Our team of data experts will work closely with you to identify the metrics that matter most to your business, and then design reports and dashboards that bring those metrics to life.


